Data Deep Dive Into LearnWise AI: Key Metrics Driving AI Success in Higher Education

Artificial intelligence is becoming foundational to how universities support students, scale services, and improve teaching and learning. Yet as AI adoption increases, a critical challenge remains: how do institutions measure whether AI is actually delivering value?
This data deep dive explains how higher education institutions can measure AI success using metrics, KPIs, and ROI grounded in real analytics from the LearnWise AI platform, and how these insights support better decision-making across academic, operational, and leadership teams.
The challenge of measuring AI in higher education
Measuring the impact of AI in higher education is fundamentally more complex than measuring traditional software tools. Many institutions lack clear baseline data, do not consistently track operational metrics, and often have limited alignment across departments on how success should be defined.
A survey from education research firm EAB found that nearly two-thirds (62%) of university student success staff believe AI can help identify students who need support, and 69% report having used AI in their work over the past year. However, only about 20% say their institution is actively collecting data on how AI is being used. At the same time, AI adoption is accelerating: an Ellucian survey found that 84% of higher education professionals used AI in their professional or personal lives in the past year.
While many institutions have launched initial AI pilots, scaling these initiatives often proves difficult. Without clear evidence of impact on student experience, faculty workload, or operational efficiency, leaders struggle to justify continued investment or institution-wide deployment.
In many cases, institutions do not measure foundational indicators before AI adoption, such as:
- Time spent handling student inquiries
- Average grading turnaround time
- Support staffing workload and costs
- Student effort spent navigating systems
- Gaps or inconsistencies in institutional knowledge
Without these baselines, demonstrating improvement or ROI becomes challenging.
At the same time, concerns around data privacy, security, and bias continue to rise. One survey shows year-over-year increases in institutional concern about AI bias and data protection, often slowing or limiting broader adoption.
The challenge is not reluctance to measure AI outcomes, but it is a lack of frameworks, integrated data access, and institutional coordination. Universities rely on siloed systems, and different departments define “success” differently. As a result, many AI initiatives remain small-scale experiments rather than strategic assets.
To overcome this, institutions need:
- Reliable, exportable AI data
- Clear and consistent metrics
- Guidance on translating metrics into KPIs
- Frameworks for connecting KPIs to ROI
Without these elements, AI remains a black box. With them, it becomes a measurable, strategic asset that can demonstrate real value across teaching, support, and operations.
The difference between AI metrics, KPIs, and ROI
AI success in higher education should be evaluated across three distinct but connected layers: metrics, KPIs, and ROI.
Metrics: Understanding AI performance and adoption
Metrics are the quantitative data points generated by AI systems. AI solutions offer a host of metrics institutions can follow to understand adoption, challenges, and success rates. They describe what is happening: how often AI is used, what types of questions are asked, and how effectively the system responds.
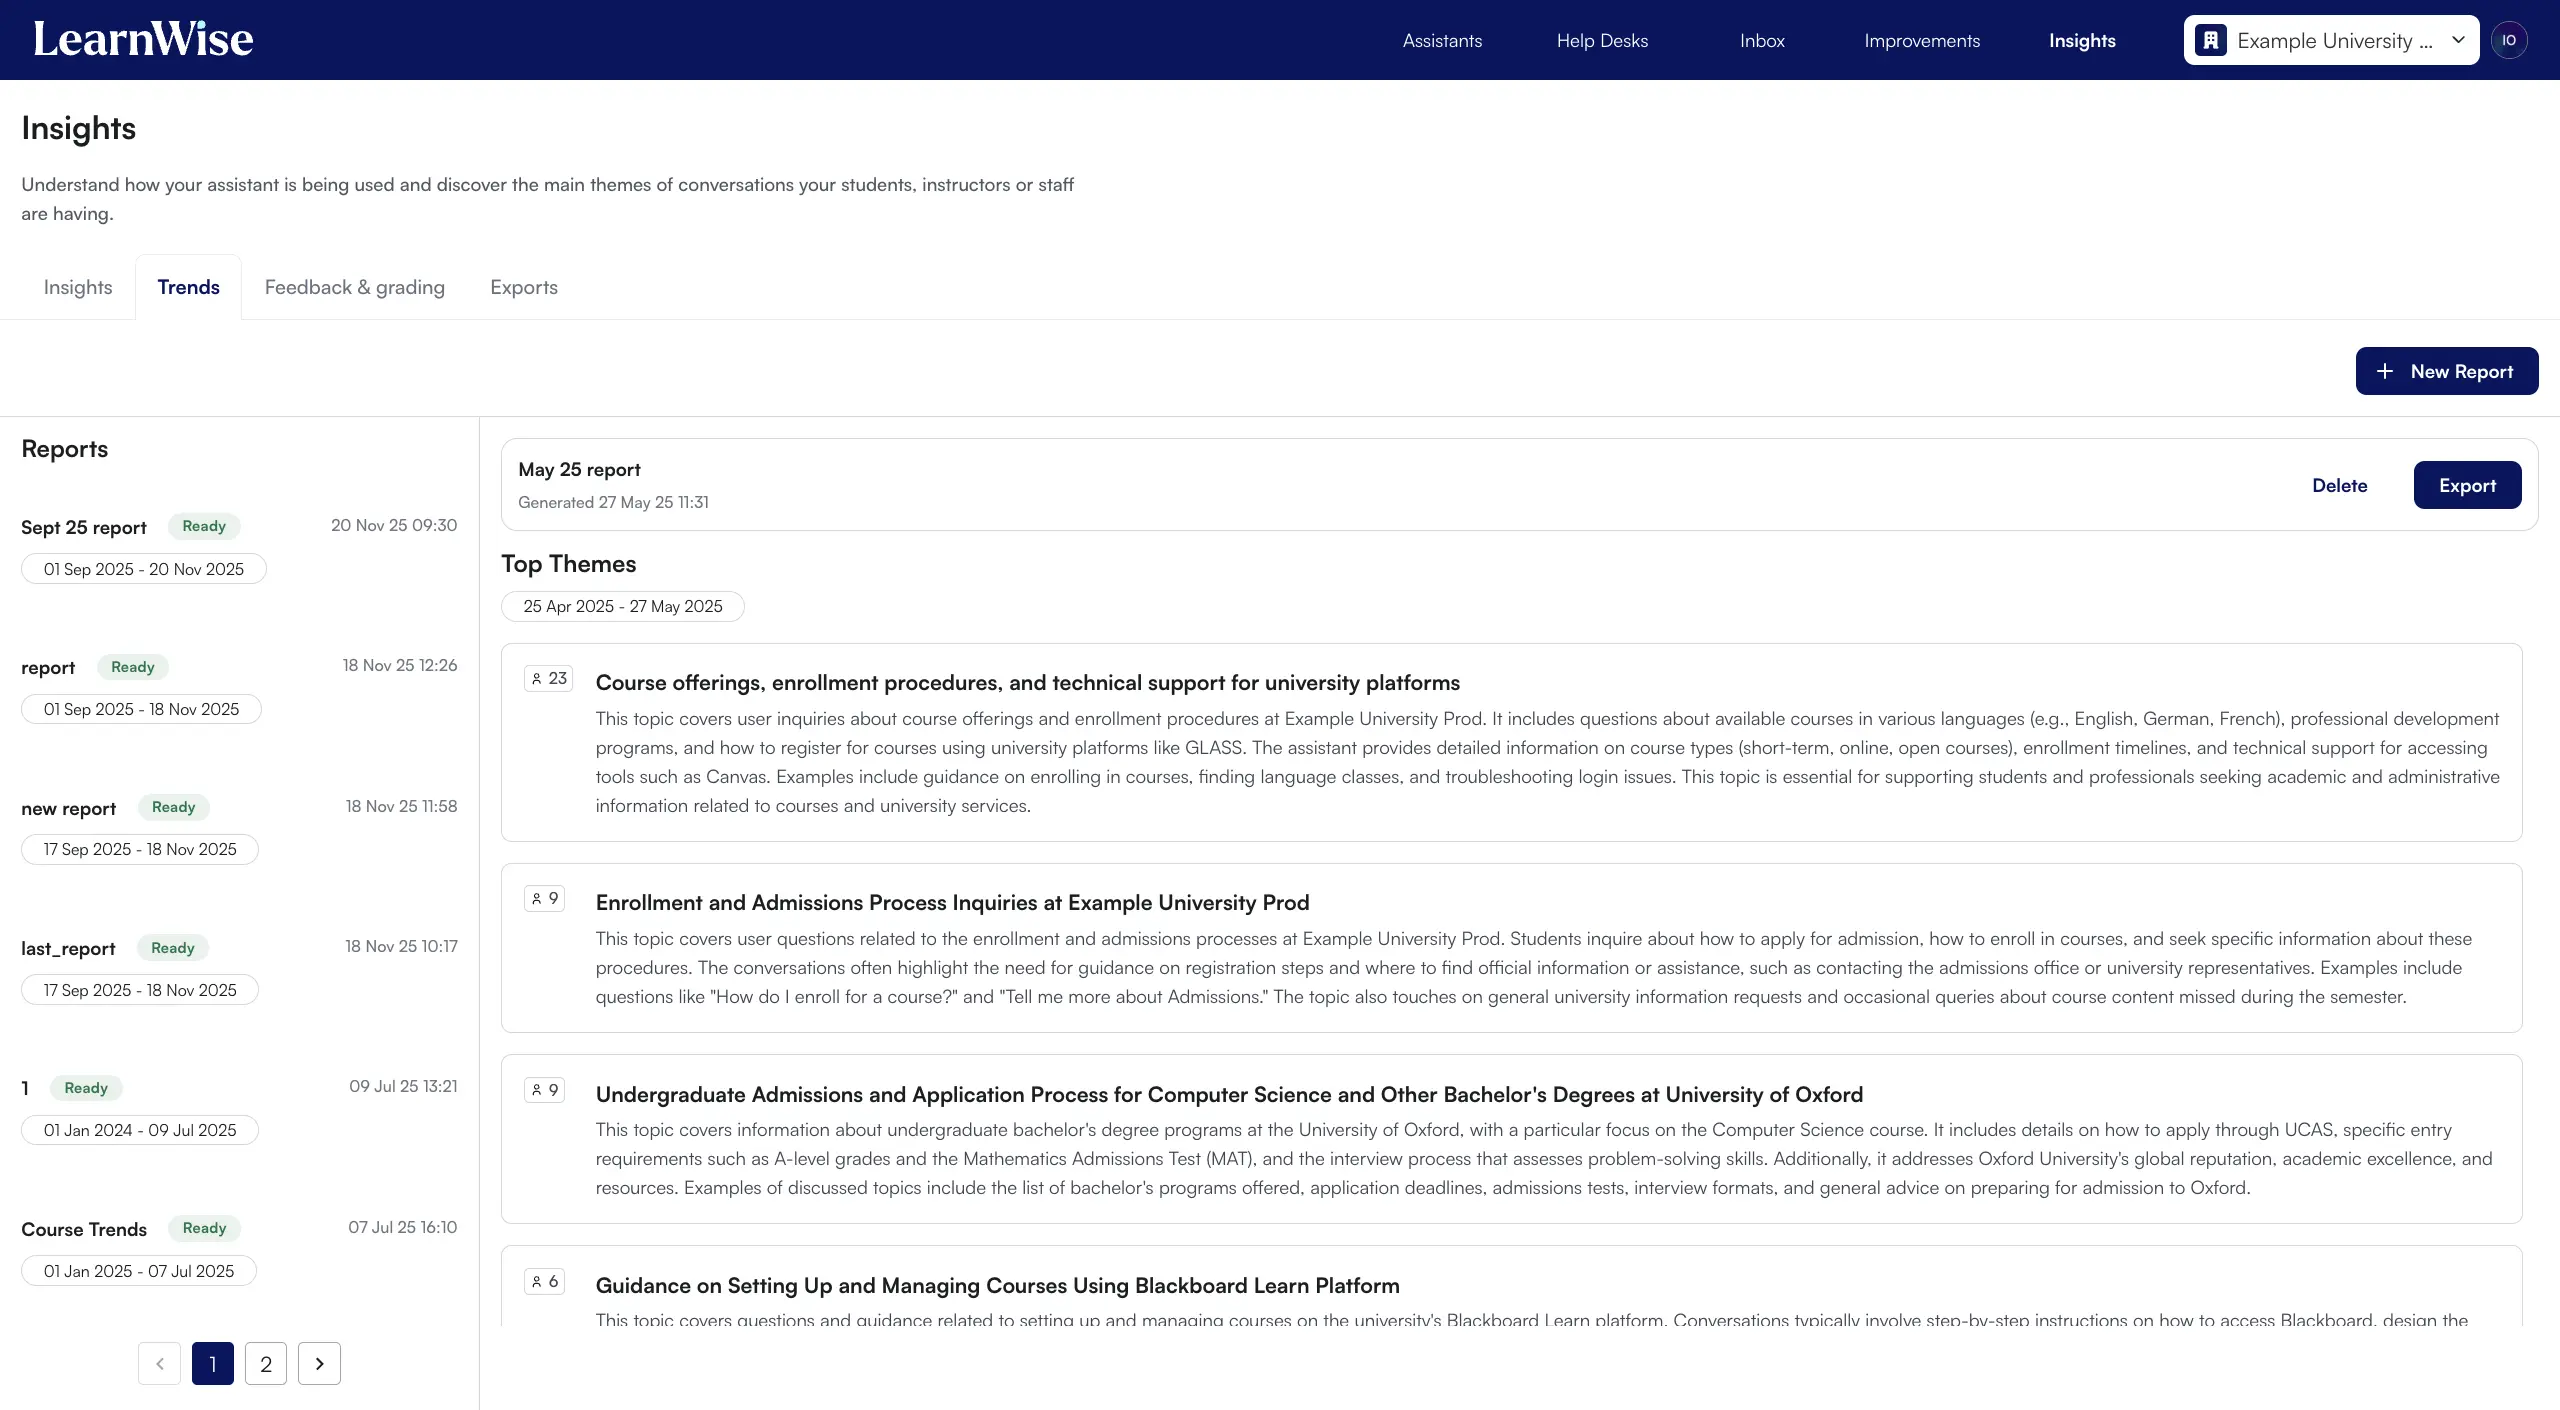
LearnWise AI provides institutions with detailed metrics through its Insights Dashboard, including:
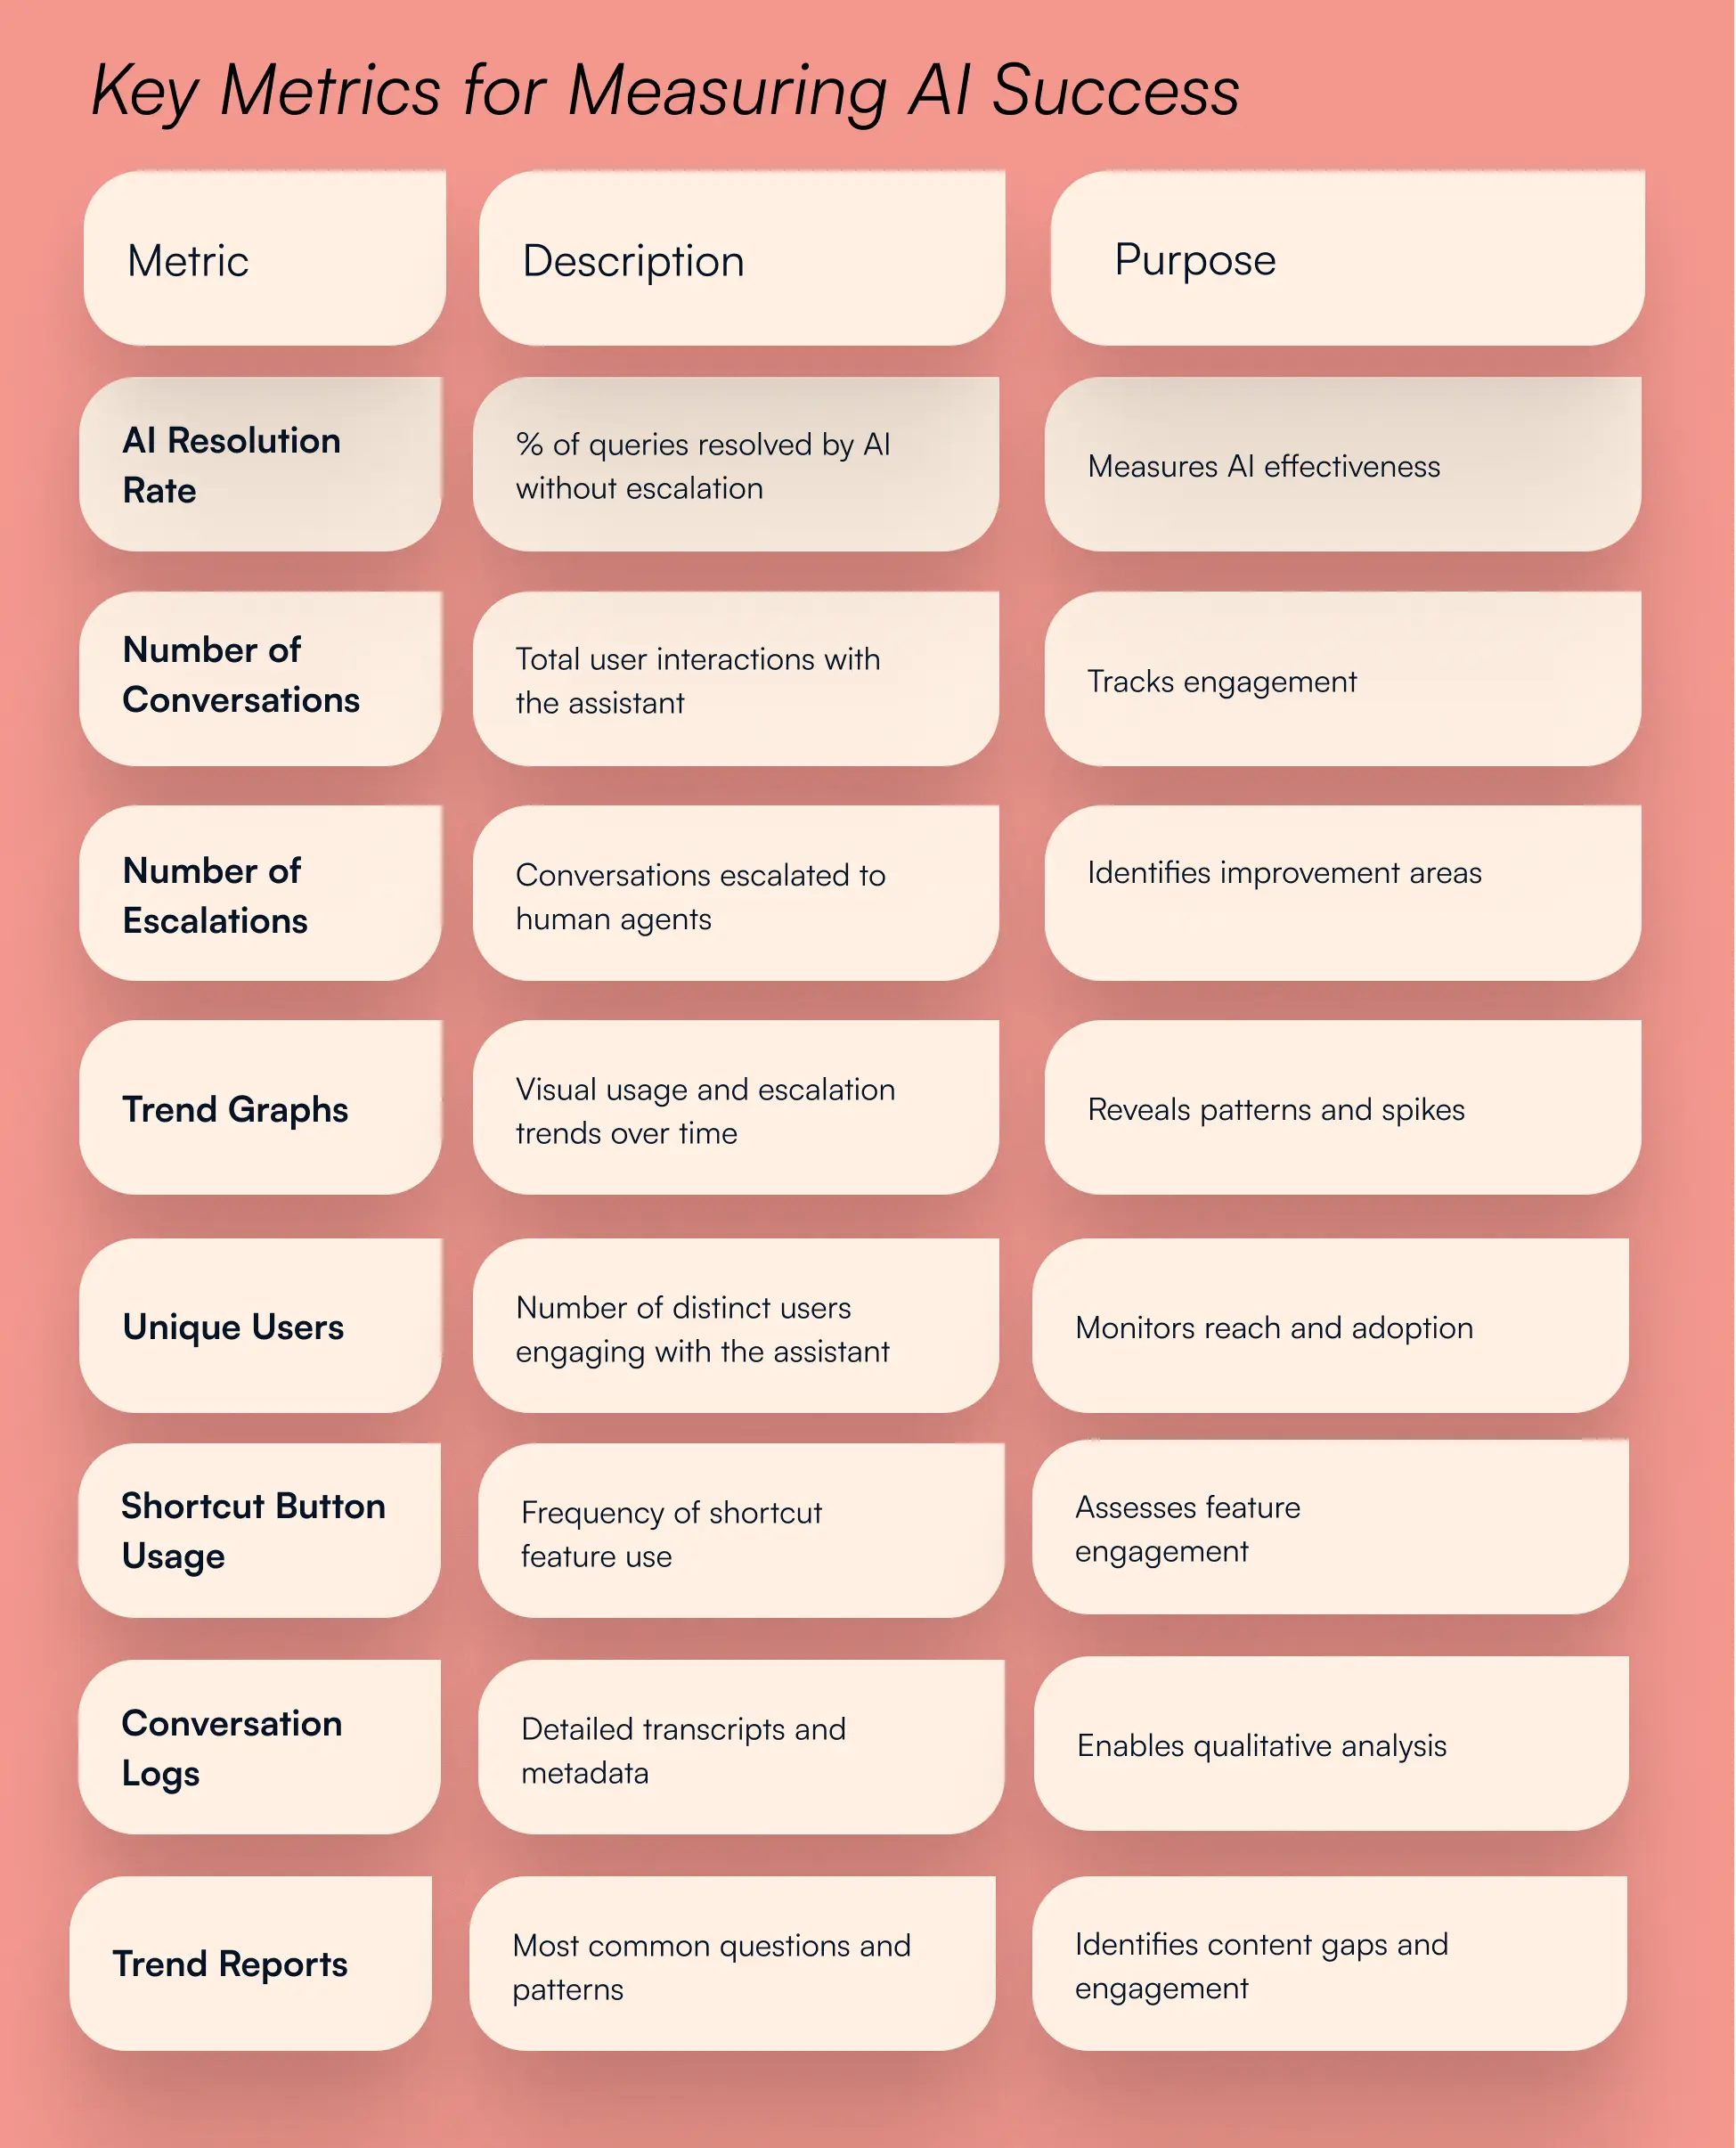
By understanding these key metrics, institutions can better understand AI adoption patterns at their organization by role - students, faculty and staff. These data points help inform how well queries are being resolved with AI, or how often the tool is being used, plus the quality of the information being provided. However, institutions can use these data points to move towards strategy - where can information access be improved? Are there knowledge gaps, surfaced by repetitive questions with poor/little context in the provided answers? These data points describe what is happening but do not, on their own, define success.
KPIs: Defining institutional success targets
Key Performance Indicators (KPIs) translate metrics into institutional goals. They reflect what the institution aims to achieve based on its priorities. While LearnWise provides the data, institutions define the KPIs based on their strategic priorities.
In higher education, AI KPIs often focus on:
- Student support quality
- Operational efficiency
- Teaching and learning effectiveness
Examples of AI-related KPIs include:
- Reducing Tier 1 support tickets by 30% or more
- Maintaining knowledge base freshness above 90%
- Improving grading turnaround time by 20%
- Achieving 95% satisfaction with AI-generated feedback
LearnWise metrics shown below support these KPIs by enabling institutions to track resolution rates, escalation patterns, knowledge gaps, and user satisfaction in real time.
.webp)
How do metrics provided by LearnWise support KPIs for institutional goals?
- Improved Student Support: By tracking and increasing the AI resolution rate, institutions can ensure students receive timely, accurate answers, improving satisfaction and retention.
- Resource Optimization: Monitoring escalation and operational efficiency metrics helps reduce the burden on human support teams, allowing staff to focus on complex cases.
- Continuous Improvement: Knowledge gap and trend insights enable data-driven updates to support content and processes.
- Strategic Planning: Usage and engagement metrics inform decisions about scaling digital support and investing in new resources.
ROI: Demonstrating institutional value
Institutional Return on Investment (ROI) measurements in higher education refer to the quantifiable benefits an institution gains from its investments, such as technology, staffing, or support systems, relative to the costs incurred. These measurements help leadership assess whether a solution like LearnWise AI delivers value in terms of efficiency, cost savings, student outcomes, and overall institutional effectiveness.
Key ROI in Higher Education
In higher education, ROI typically includes:
- Cost Savings: Reduction in operational costs, such as support staffing or manual processes.
- Efficiency Gains: Faster response and resolution times for student and staff queries.
- Support Case Deflection: Percentage of queries resolved by AI, reducing the need for human intervention.
- Student Satisfaction: Improvements in student experience and feedback.
- Retention and Success Rates: Impact on student retention, engagement, and academic success.
- Scalability: Ability to support more users without proportional increases in cost or staff.
- Quality of information: the accuracy, relevance, and reliability of the information provided by the AI assistant in response to user queries.
- Knowledge gap closure: This metric tracks the identification and resolution of missing, outdated, or unclear information in the AI’s knowledge base.
Where AI adoption metrics inform an institution how students, staff and faculty are using AI and KPIs chart a path for institutions to track their success implementing it, ROI answers why it matters at the institutional level.
Why this distinction matters
Understanding the difference between metrics, KPIs, and ROI allows institutions to:
- Set realistic, measurable goals
- Secure funding and leadership buy-in
- Scale AI responsibly
- Govern AI use transparently
This is where LearnWise differentiates itself. LearnWise platform provides transparent data, exportable insights, and dashboards that allow institutions to track metrics, define KPIs, and calculate ROI with confidence.
The data LearnWise provides to institutions
What institutions can see in dashboards
LearnWise gives institutions comprehensive visibility into AI activity through role-based dashboards, including:
- Conversation Logs: Filterable, full interaction histories with timestamps, metadata, and escalation events
- Usage Analytics: Resolution rates, conversation volume, unique users, trends and more - all filterable per assistant, help desk and channel
- Knowledge Gap Tracking: An Improvements workflow to identify and resolve content gaps
- Answer Ratings: Positive and negative feedback on AI responses
- Role-Based Access: Granular permissions for administrators, support agents, and data viewers
What data can be exported
Institutions using LearnWise AI have access to robust data export features, primarily through the platform’s Inbox and Insights tools. Exporting this data allows institutions to audit assistant performance, track escalation volumes, identify user engagement patterns, integrate with other analytics tools, and maintain data governance with full download history.
Below, an overview of what data can be exported by solution:
- AI Campus Support:
- All chat conversations and metrics can be exported.
- AI Student Tutor:
- All tutor conversations and metrics can be exported.
- AI Feedback & Grader:
- Feedback and grading usage metrics and session history can be exported.
For all solutions, LearnWise provides knowledge management data, ensuring usage and improvement logs can be reviewed and exported for analysis.
All these products feed their interaction data into the central Inbox and reporting system, allowing for unified export and analysis.
To maintain high privacy and compliance standards, data exported using LearnWise AI has the option to anonymize user data. Administrators can also download logs for compliance and governance, and are able to configure data retention preferences according to institutional policy. These measures ensure AI usage is safe and compliant with institutional guardrails, not the other way around.
Governance and trust: How LearnWise reduces risk
LearnWise AI is designed with a strong commitment to both transparency and institutional data ownership, aligning with leading industry standards and educational best practices.
Transparency by design
LearnWise AI provides detailed information regarding security practices, data handling, and privacy measures through its Trust Center. This includes documentation on security controls, compliance certifications, and subprocessors.
LearnWise is fully compliant and certified for:
- ISO 27001 v2022: International standard for information security management.
- GDPR: Ensures transparency in data collection, processing, and user rights for all users, especially those in the EU.
- SOC 2: Focuses on security, availability, processing integrity, confidentiality, and privacy of customer data.
These frameworks require clear documentation, regular audits, and transparent communication about data practices.
Below are two key product features that promote transparency:
- User and Admin Visibility: All conversation data and user interactions are accessible only to authorized university administrators. This allows institutions to audit, review, and understand how data is being used and how the AI is performing, ensuring transparency in support and analytics processes.
- No Use of Conversational Data for Training: LearnWise does not use student or staff conversations for training its AI models outside the institution. Conversations are kept within a closed environment, and are only used for institutional review and improvement, not for external AI development or third-party purposes.
Institutional Ownership of Data
Maintaining high security and compliance standards is essential in higher education. That’s why all data collected by LearnWise belongs to the institution implementing it. Here are a few key ways in which LearnWise ensures institutions remain in the driver’s seat when implementing and evaluating AI tools:
- Data Control: All data collected by LearnWise AI (including usernames, emails, student numbers, and conversation logs) is stored in a secure, closed environment. Only the institution’s administrators have access to this data, ensuring that the institution retains full control and ownership.
- Training on Institution-Owned Content: The AI assistant is trained exclusively on resources, documentation, and materials that are fully owned or provided by the institution. This ensures that the knowledge base reflects the institution’s policies and that the institution maintains intellectual property rights over the content used.
- Data Export and Access: Institutions can export all conversation and usage data for their own analysis, compliance, or reporting needs. This supports institutional data governance and ensures that data is not locked into the LearnWise platform.
- Privacy and Security Policies: LearnWise maintains a comprehensive set of security and privacy policies, including a Data Retention Policy, Data Protection Policy, and Data Processing Addendum (DPA), all available for institutional review in the Trust Center Resources.
Download the study


Download the whitepaper

Turning data into KPIs: How institutions measure success
Baseline measurement before deployment
You can’t manage what you can’t measure. This is why, before launching AI implementation, we typically encourage institutions to collect baseline data on their current support and engagement processes. This is a step where most institutions find they have very little - or no data - to compare from.
Before implementing AI, institutions should collect baseline data such as:
- Support query volume and handling time
- Escalation rates
- Faculty grading workload
- Student satisfaction scores
- Operational support costs
Having a clear picture of the current state of affairs will help measure improvements with AI tools after implementation a lot more easily. In this way, institutions can set KPIs, understand their roadmap to AI adoption long term, and provide a clear picture of ROI for future adoption plans.
Departmental KPIs for AI success
When setting KPIs, we believe there is a no one-fits-all approach. When implementing AI solutions across departments, it’s important to understand the different goals and ambitions behind implementing AI assistants. LearnWise provides analytics and reporting tools that can be tailored to the needs of different departments:
- IT Department:
- Track support ticket volumes, resolution rates, and escalation rates via the Insights tab.
- Monitor system uptime and integration performance.
- Program Management:
- Use Insights to monitor student engagement with program resources and support queries related to program administration.
- Analyze trends in student questions to identify program-level pain points.
- Teaching & Learning:
- Leverage course-level insights to track student engagement, frequency of assistant use, and common academic queries.
- Review conversation logs (if enabled) for qualitative feedback on teaching materials and student needs.
- For more information, see what insights are available to instructors at the course level, and how they can be leveraged here.
- Student Services:
- Monitor the volume and type of student support requests.
- Track resolution rates and escalation to human support.
- Identify trends in student needs and service gaps.
LearnWise Insights allow all these KPIs to be tracked in one platform.
Surveys and qualitative data
Typically, institutions opt to roll out AI solutions in one or two departments before choosing an institutional roll-out. In this way, feedback collection is an essential part of the decision-making process. Here are the ways LearnWise collects feedback to inform AI implementation decisions:
Feedback Collection:
- LearnWise AI collects feedback from users after conversations, which can be used to measure satisfaction and identify areas for improvement.
- This feedback loop is built into the platform and is accessible to administrators for review and analysis.
- See: Communication Guide: Launching an AI Assistant At Your Institution
Qualitative Data:
- Conversation logs and transcripts (with appropriate permissions) provide rich qualitative data on user needs, pain points, and the effectiveness of support.
- These logs can be filtered and exported for deeper analysis.
This ensures institutions understand both what is happening and why.
Connecting KPIs to ROI
Demonstrating the return on investment (ROI) of AI in higher education requires more than post-deployment analytics. Institutions must first establish clear baselines, then track LearnWise AI performance over time, and finally compare outcomes to quantify operational, academic, and financial impact.
1. Establish baseline measurements before implementation
Before deploying LearnWise AI, institutions should document their current state using data from existing systems. These baseline measurements create the reference point required to calculate ROI after implementation.
Recommended baseline metrics include:
- Volume of support queries by channel (email, phone, help desk, LMS)
- Average response and resolution times for Tier 1 inquiries
- Escalation rates to human staff
- Support staffing hours and associated costs
- Student and staff satisfaction scores related to support services
- Common support topics and recurring issues
- Faculty grading turnaround times and estimated hours spent on feedback
These data points are typically available through ticketing systems, LMS analytics, faculty workload reports, institutional research dashboards, and HR or finance systems. Capturing them before launch ensures that improvements driven by LearnWise can be measured accurately and credibly.
2. Track LearnWise AI metrics after implementation
Once LearnWise AI is deployed, institutions can use the platform’s analytics and Insights dashboards to monitor key performance indicators and compare them against baseline data.
Key LearnWise KPIs include:
AI Resolution Rate
The percentage of queries resolved by the AI without escalation to human staff. Many institutions target a 50–80% AI resolution rate, depending on content quality, institutional complexity, and training maturity. This metric directly supports calculations of time saved and support case deflection.
Number of Conversations
The total number of interactions handled by the AI assistant. This metric provides visibility into adoption, engagement, and overall demand for digital support.
Number of Escalated Conversations
The volume of conversations routed to human agents. Tracking escalation patterns helps institutions understand query complexity, identify training opportunities, and ensure the right balance between automation and human support.
Trend Insights
Analysis of recurring topics, themes, and support drivers across time. Trend Insights reveal shifts in student and staff needs and help evaluate how effectively AI addresses emerging or seasonal issues.
Support Trends and Volume
Changes in the volume, timing, and type of support requests over time. These trends are particularly useful for capacity planning and resource allocation during peak academic periods.
User Satisfaction and Feedback
Direct feedback collected after AI interactions provides qualitative and quantitative insight into service quality, trust, and user experience.
Operational Efficiency
Metrics related to staff workload, response times, and throughput allow institutions to connect AI usage directly to cost savings, reduced burnout, and improved service delivery.
Together, these KPIs enable institutions to move from descriptive AI usage data to outcome-based performance measurement.
3. How to access and use these metrics in LearnWise
LearnWise provides multiple tools for accessing, analyzing, and operationalizing AI performance data:
Insights Dashboard
The LearnWise admin portal includes an Insights tab where institutions can filter and analyze metrics by AI assistant, role, date range, and topic. This supports both day-to-day monitoring and long-term performance analysis.
Support Trends Report
The Support Trends Report highlights recurring issues, topic frequency, and changes over time. Institutions can use this report to assess the impact of content updates, policy changes, or process improvements and to inform future strategies.
Data export and integration
All conversation data, metrics, and reports can be exported for further analysis or integration with institutional BI tools, data warehouses, or reporting workflows. This ensures LearnWise data can be aligned with finance, HR, and institutional research systems for comprehensive ROI analysis.
4. Recommended KPI comparison table
.webp)
5. Continuous improvement and ROI validation
Regular monitoring
Institutions should review LearnWise metrics on a recurring basis to identify trends, performance gaps, and opportunities for optimization.
Content and knowledge updates
Knowledge Gap Insights enable teams to continuously update and expand the AI’s knowledge base, improving resolution rates and user satisfaction over time.
Collaboration with LearnWise
Working closely with LearnWise support teams helps institutions refine AI training, respond to emerging needs, and ensure analytics align with institutional KPIs and ROI goals.
By combining baseline measurements with ongoing LearnWise analytics, institutions can confidently demonstrate AI’s institutional value, supporting sustainable investment, responsible scaling, and long-term impact.
Product deep dives: What success looks like
Each LearnWise AI product supports different institutional goals, from improving student learning experiences to reducing operational burden and faculty workload. While success metrics vary by use case, they all contribute to measurable institutional outcomes when tracked consistently.
Below is a closer look at what success looks like across the LearnWise AI Student Tutor, AI Campus Support, and AI Feedback & Grader.
AI Student Tutor success metrics
The LearnWise AI Student Tutor provides personalized, in-context academic support directly inside the LMS. It helps students with course navigation, studying, and practice through features such as study plans, practice quizzes, and instant answers to course-related questions. By meeting students where they already learn, the AI Tutor reinforces instructional design goals and promotes continuous engagement.
What differentiates the LearnWise AI Student Tutor is its deep, context-aware LMS integration. Students receive assistance within the exact course, assignment, or learning environment they are working in without switching tools or platforms. The Tutor supports 107 languages, is pre-trained on more than 400 EdTech tools, and is LTI 1.3–ready for secure, scalable deployment.
Key success metrics for the AI Student Tutor include:
- Student engagement: Number of students actively using the Tutor and frequency of interactions over time
- Resolution rate: Percentage of student questions answered without escalation to instructors or support staff
- Time savings: Reduction in time students spend searching for answers, resources, or clarification
Learn more about the AI Student Tutor.
AI Student Tutor: Why these metrics matter
- Student engagement: Sustained engagement indicates that students find the Tutor useful and accessible. High usage demonstrates that AI support is embedded in learning workflows rather than sitting unused in the LMS.
- Learning outcomes: When combined with course performance or assessment data, Tutor usage can help institutions understand how timely academic support contributes to comprehension and success.
- Resolution rate: A high resolution rate means students receive immediate answers without waiting for faculty, improving satisfaction while reducing instructional interruptions.
- Time savings: Faster access to information allows students to spend more time learning and less time navigating systems or searching for help.
- Feedback quality: Student satisfaction with explanations ensures the AI is not only fast, but accurate, relevant, and pedagogically sound.
Together, these metrics help institutions demonstrate the Tutor’s academic value, guide ongoing improvements, and ensure AI is meaningfully supporting student success.
AI Campus Support success metrics
LearnWise AI Campus Support is a 24/7, multilingual, role-aware assistant designed to handle academic, administrative, and IT inquiries at scale. It provides instant answers, routes complex cases to the appropriate department, and integrates with major LMS platforms, student portals, CRM systems, and ticketing tools such as ServiceNow, Salesforce, JitBit, and TeamDynamix.
The solution supports 107 languages and consistently achieves high AI resolution rates, often between 90–97% for Tier 1 inquiries. Responses are tailored by user role—student, faculty, or staff—and delivered across multiple digital touchpoints. Real-time analytics support continuous service improvement.
Key success metrics for AI Campus Support include:
- Time-to-resolution: Average time required to resolve Tier 1 inquiries
- Resolution rate: Percentage of queries resolved by AI without human intervention
- Escalation rate: Frequency of cases routed to human support teams
- Knowledge freshness: How current and accurate the AI’s knowledge base remains
- User satisfaction: Feedback from students, faculty, and staff after interactions
Learn more about the AI Campus Support.
AI Campus Support: Why these metrics matter
- Time-to-resolution: Fast responses are critical for student and staff satisfaction and reduce frustration during high-demand periods.
- Resolution rate: A high deflection rate demonstrates that AI is successfully handling routine questions, freeing staff to focus on complex or sensitive cases.
- Escalation rate: Monitoring escalations ensures the right balance between automation and human support while preventing overload.
- Knowledge freshness: Up-to-date information is essential for trust; outdated answers quickly undermine confidence in digital services.
- User satisfaction: Direct feedback highlights service quality and identifies opportunities for improvement.
Tracking these metrics helps institutions prove ROI, improve service delivery, and scale support operations sustainably.
AI Feedback & Grader success metrics
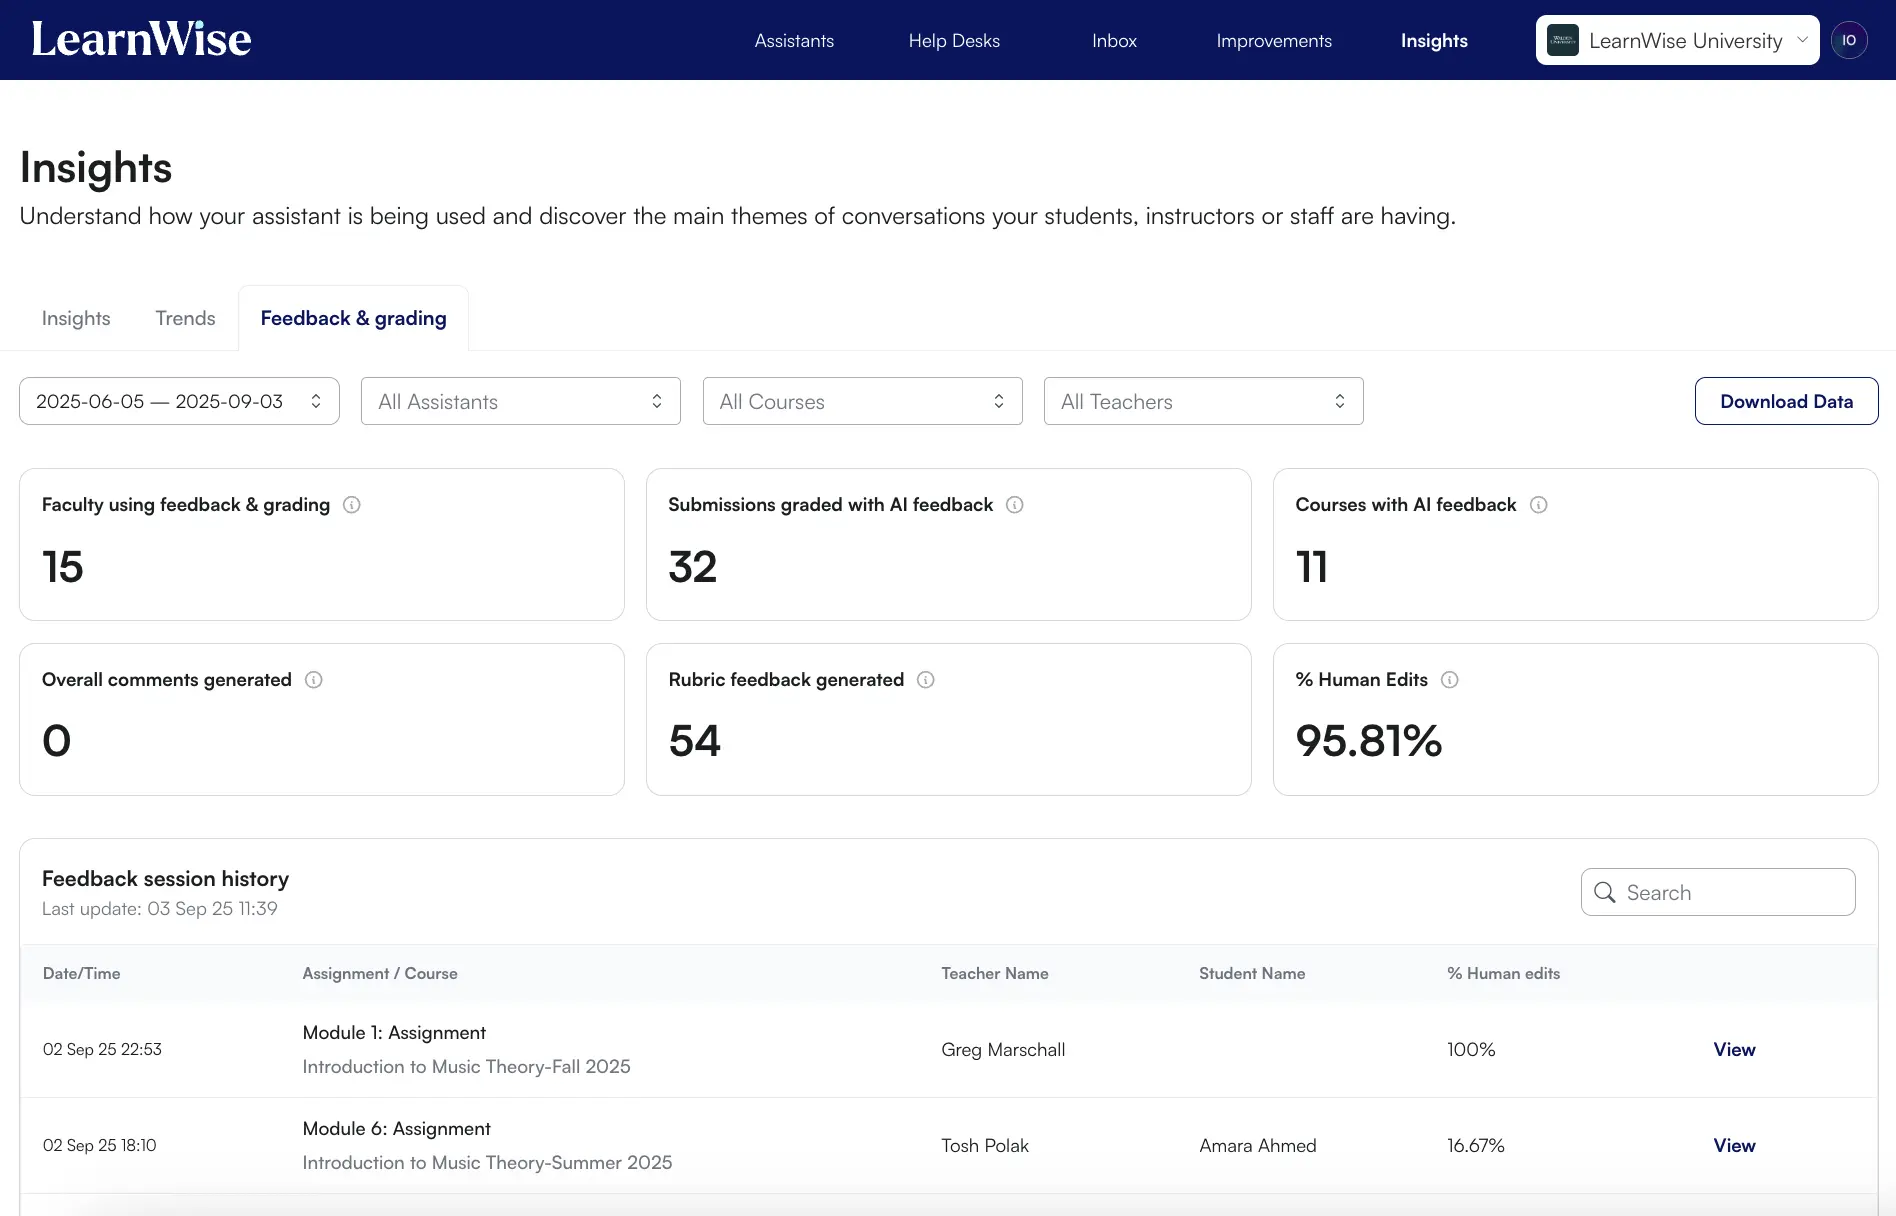
The LearnWise AI Feedback & Grader streamlines grading and feedback workflows by generating rubric-aligned, actionable feedback at scale while keeping instructors fully in control. Faculty can review, edit, or regenerate AI-generated feedback, ensuring academic rigor and alignment with course standards.
The solution integrates seamlessly with major LMS platforms including Canvas, Brightspace and Moodle. It supports multiple assessment types, multilingual feedback, and compliance with institutional and regulatory requirements such as GDPR, ISO, SOC 2, and FERPA. Real-time analytics provide visibility into grading trends and feedback quality.
Key success metrics for AI Feedback & Grader include:
- Faculty time saved: Reduction in hours spent grading and providing feedback
- Feedback consistency: Alignment of feedback with rubrics, tone, and learning outcomes
- Turnaround time: Speed at which students receive feedback on assignments
- Student satisfaction: Student ratings of feedback clarity and usefulness
- Faculty oversight: Degree of instructor review and adjustment of AI-generated feedback
Learn more about the AI Feedback & Grader.
AI Feedback & Grader: Why these metrics matter
- Faculty time saved: Reduced grading time allows educators to focus on teaching, mentoring, and curriculum development.
- Feedback consistency: Rubric-aligned feedback supports fairness, equity, and academic standards across large cohorts.
- Turnaround time: Faster feedback enables students to act on guidance while learning is still active.
- Student satisfaction: Clear, actionable feedback encourages engagement and improvement.
- Faculty oversight: Maintaining instructor control preserves trust, transparency, and academic integrity.
Together, these metrics help institutions evaluate efficiency gains, teaching quality, and the broader impact of AI on learning and assessment.
Download the study
Download the whitepaper
Using LearnWise data to improve student experience, teaching efficiency, and operational performance
To fully understand ROI, institutions must pair LearnWise analytics with their own baseline and ongoing institutional measurements. While LearnWise provides detailed AI usage, resolution, and engagement data, meaningful ROI emerges when this data is connected to operational, academic, and financial indicators already tracked (or newly established) by the institution.
Measuring baseline data: where institutions should look
Most institutions already possess the data needed to measure AI impact, but it's distributed across systems. Below are concrete recommendations for where and how to source baseline data before implementation.
Operational and support efficiency
To quantify time saved and cost reduction, institutions should establish baselines from existing support systems:
- Average handling time per Tier 1 inquiry
- Number of support requests per month by channel
- Percentage of inquiries escalated to staff
- Average time-to-resolution
- Staff hours allocated to routine support
- Overtime or temporary staffing costs during peak periods
How this connects to LearnWise
After deployment, LearnWise AI resolution and escalation metrics can be compared directly against these baselines to calculate:
- Support hours avoided
- Cost savings per resolved inquiry
- Reduced backlog during peak periods
Teaching and assessment efficiency
To assess the impact of AI Feedback & Grader and AI Tutor, institutions should establish teaching-related baselines using instructional systems and faculty workflows.
Where to source the data
- LMS analytics (Canvas, Brightspace, Moodle, Blackboard)
- Faculty workload reports or surveys
- Assessment submission and grading timestamps
- Teaching and learning center reports
What to measure
- Average grading turnaround time per assignment
- Estimated faculty hours spent on grading and feedback
- Number of assessments graded per term
- Frequency of student clarification requests after feedback
- Faculty satisfaction with grading workflows
How this connects to LearnWise
Post-implementation data from LearnWise can be used to quantify:
- Faculty time saved per course or term
- Faster feedback cycles for students
- Increased consistency and clarity in feedback
Student experience and learning outcomes
While AI impact on learning outcomes is multifactorial, institutions can establish experience and engagement baselines to contextualize AI usage.
Where to source the data
- Student satisfaction surveys (course evaluations, NSS, internal surveys)
- LMS engagement metrics
- Advising and tutoring usage reports
- Institutional research and retention data
What to measure
- Student satisfaction with academic and administrative support
- Time spent searching for course or institutional information
- Frequency of repeated support requests
- Course completion and retention indicators
- Usage of existing tutoring or support services
How this connects to LearnWise
LearnWise usage, resolution, and feedback data can be layered on top of these measures to assess:
- Improved access to timely support
- Reduced friction in navigating systems
- Higher satisfaction with academic assistance
Identifying trends with LearnWise Insights
Once LearnWise AI is deployed, institutions gain access to rich trend analysis that reveals how students, faculty, and staff interact with digital support and learning resources over time. These insights move institutions beyond anecdotal reporting and into evidence-based service design.
Using LearnWise Insights, institutions can:
- Identify recurring support drivers by analyzing the most common questions, topics, and workflows generating demand across academic and administrative services.
- Detect seasonal and cyclical spikes in demand, such as increased support requests during registration, assessment periods, or the start of term.
- Compare usage patterns across roles, courses, programs, or departments, revealing where additional support or targeted interventions may be needed.
- Measure the impact of changes by tracking shifts in volume, resolution rates, and escalation trends after content updates, policy changes, or process improvements.
These trend insights enable institutions to transition from reactive support models where issues are addressed only after problems arise to anticipatory, data-informed service design. Over time, this improves responsiveness, reduces bottlenecks, and aligns support services more closely with actual user needs.
Finding and closing knowledge gaps
A key driver of AI effectiveness and institutional ROI is the quality and completeness of the underlying knowledge base. LearnWise systematically surfaces knowledge gaps using multiple data signals, including:
- Low AI resolution rates tied to specific topics or resources
- Clusters of escalations around the same question types or workflows
- Negative or neutral user feedback on AI responses
- Repeated or rephrased questions across different users and roles
These insights help institutions move from assumption-based content management to usage-driven knowledge governance. Once gaps are identified, institutions can assign ownership to the appropriate teams such as IT, student services, registrar’s offices, or teaching and learning units, and track progress using the LearnWise Improvements workflow.
Closing knowledge gaps improves AI accuracy, reduces escalation volume, and increases trust in digital support—directly contributing to higher resolution rates and better user satisfaction.
Continuous improvement loops
LearnWise is designed to support a continuous, measurable improvement cycle that aligns AI performance with institutional goals:
- Establish baselines using existing institutional systems (support tools, LMS data, surveys, staffing metrics)
- Deploy AI and monitor performance through LearnWise metrics and dashboards
- Identify gaps and inefficiencies in content, workflows, or escalation paths
- Implement targeted improvements, such as updating documentation or refining routing logic
- Re-measure outcomes against original baselines to quantify impact
This structured feedback loop ensures AI performance improves over time rather than stagnating after initial deployment. It also allows institutions to demonstrate progress with evidence, not assumptions.
How leadership teams apply the insights
For institutional leadership, LearnWise insights provide a critical foundation for strategic decision-making. By combining LearnWise analytics with institution-owned data, leadership teams can:
- Validate AI ROI with defensible evidence, rather than estimates or anecdotal reports
- Support budget planning and staffing decisions with real usage and efficiency data
- Report outcomes clearly to executive leadership, boards, and governance committees
- Guide responsible AI governance, ensuring transparency, accountability, and compliance
- Scale AI initiatives confidently from pilot projects to institution-wide adoption
By clearly defining baseline sources, tracking performance over time, and linking AI metrics to institutional outcomes, universities transform LearnWise data into auditable, decision-ready ROI insights, supporting sustainable, long-term AI adoption across the institution.
Conclusion: Building a transparent, measurable AI strategy in 2025 and beyond
As AI adoption accelerates across higher education, the institutions that succeed will not be those that deploy the most tools, but those that measure, govern, and continuously improve them.
Measuring AI success as a competitive advantage
In an increasingly competitive and resource-constrained environment, measurable AI outcomes are becoming a strategic differentiator. Institutions that can clearly demonstrate improved student support, reduced operational burden, faster feedback cycles, and higher satisfaction are better positioned to attract students, retain staff, and justify investment in digital innovation.
AI metrics, KPIs, and ROI are no longer optional, but they are essential for scaling responsibly and sustainably.
Why transparency and data access matter
Transparency builds trust. LearnWise’s commitment to exportable data, clear dashboards, and institutional ownership ensures that AI never operates as a black box. Universities retain full visibility into how AI is used, how decisions are made, and how outcomes evolve over time.
This transparency is critical for:
- Ethical AI governance
- Regulatory compliance
- Internal alignment across departments
- Faculty and student trust in AI-supported systems
With transparency around AI data, institutions can innovate confidently.
Preparing for institution-wide AI adoption
The future of AI in higher education is integrated, accountable, and data-driven. Institutions preparing for institution-wide AI adoption must prioritize:
- Baseline measurement before deployment
- Clearly defined KPIs aligned to institutional goals
- Continuous monitoring and improvement workflows
- Strong data governance and ownership
- Leadership alignment around ROI and impact
LearnWise is built to support this journey from first pilot to full-scale deployment by giving institutions the data, insights, and control they need to turn AI into a strategic asset.
AI is no longer an experiment in higher education. With the right measurement framework, it becomes a measurable driver of student success, teaching excellence, and operational performance.


.png)
.png)

.webp)
%20(1).webp)
%20(1).webp)

